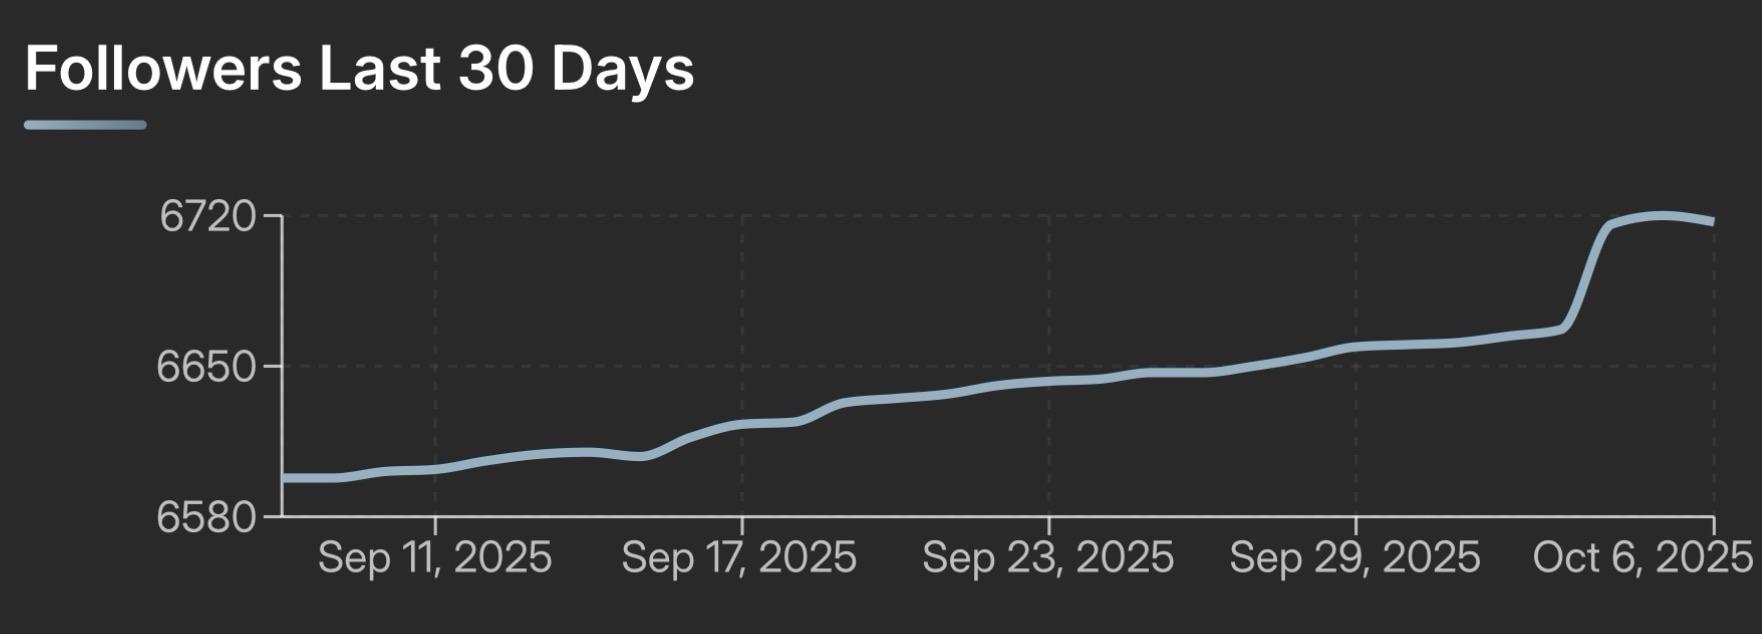
Andy Piper @[email protected] · activity timestamp last week I call this the Berlin #Fediday effect 😯 Read more Read less alt A line graph displaying follower count over the last 30 days. The x-axis marks dates from September 11 to October 6, 2025. The line is a gradual increase, but jumps up sharply towards the right side around the start of October. A line graph displaying follower count over the last 30 days. The x-axis marks dates from September 11 to October 6, 2025. The line is a gradual increase, but jumps up sharply towards the right side around the start of October. Reply Boost Quote pending approval Like More actions Copy link Flag this post Block
alt A line graph displaying follower count over the last 30 days. The x-axis marks dates from September 11 to October 6, 2025. The line is a gradual increase, but jumps up sharply towards the right side around the start of October. A line graph displaying follower count over the last 30 days. The x-axis marks dates from September 11 to October 6, 2025. The line is a gradual increase, but jumps up sharply towards the right side around the start of October.